Statistics → Content
URL: https://workspace.clips4sale.com/statistics/content
Statistics allows you to see trends for your store, giving you the ability to track and export a report of your sales and traffic. You can see where sales and hits came from so you can take the pulse of your business quickly.
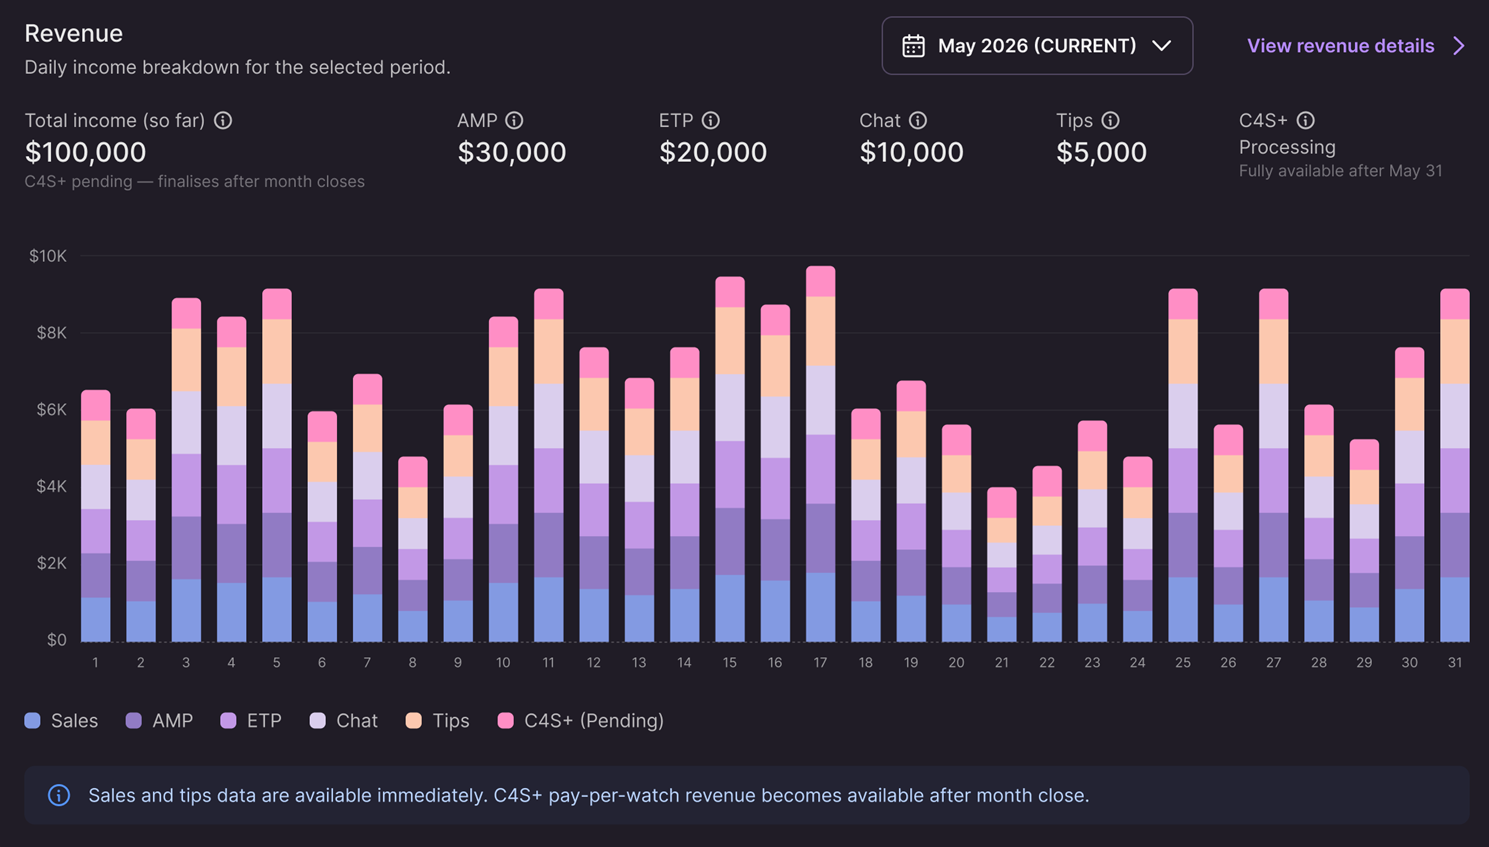
Revenue
Total income (so far) - Graph displaying total revenue across all sources for the selected period. Does not include C4S+ income while it is pending reconciliation.
AMP - Revenue generated through automated C4S email campaigns.
ETP - Revenue generated through C4S-managed paid external traffic campaigns.
Chat - All income generated in chat, including tips sent in chat, clip sales from chat, and on-demand clip sales.
Tips - Tips received outside of chat, such as the tip jar. Excludes tips sent in chat and C4S+.
C4S+ (Pending) (Processing — Fully available after the month closes) - C4S+ Sales and Tips are shown immediately. Only pay-per-watch revenue is reconciled after month close.
Sales Performance
Period starting from your store’s last payout activity date. Displays the number of purchases and total income, and the date for the upcoming payout.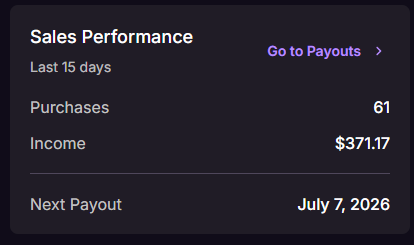
Traffic Sources
See the traffic and sales sources for the last 60 days.
- C4S - Organic C4S traffic and sales not attributed to AMP, ETP, Chat, Tips, or C4S+.
- AMP - Revenue generated through automated C4S email campaigns.
- ETP - Revenue generated through C4S-managed paid external traffic campaigns.
- Chat - All income generated in chat, including tips sent in chat, clip sales from chat, and on-demand clip sales.
- Other - Revenue from other traffic sources.
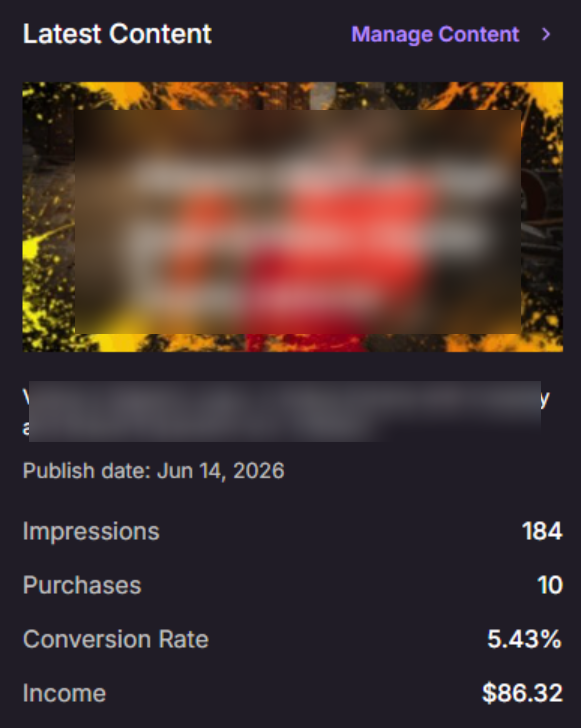
Latest Content
Displays the most recently added clip, along with its impressions, purchases, conversion rate, and revenue generated.
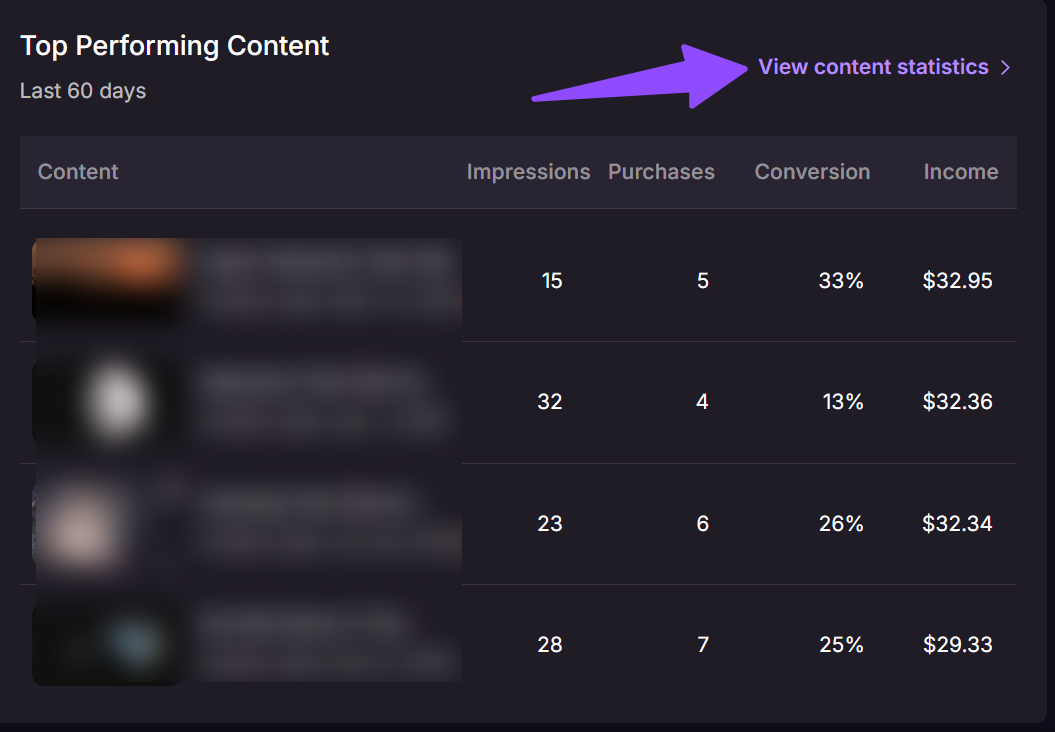
Top Performing Content in the last 60 Days
The Top Performing Content section highlights the store’s best-selling clips from the last 60 days. It helps identify which content is generating the most sales and current trends.
Click “view content statistics” for a deeper report (including transactions and C4S+ data) and the ability to export CSV.
Here you can group results by:
- Content
- Tracking Tag
- Performer
- Transaction - Transactions can be accessed right from here too, making this your go-to place to keep track of your business as it grows. A detailed transaction breakdown with sortable data fields allows you to customize the view and prioritize what’s important to you.
Content
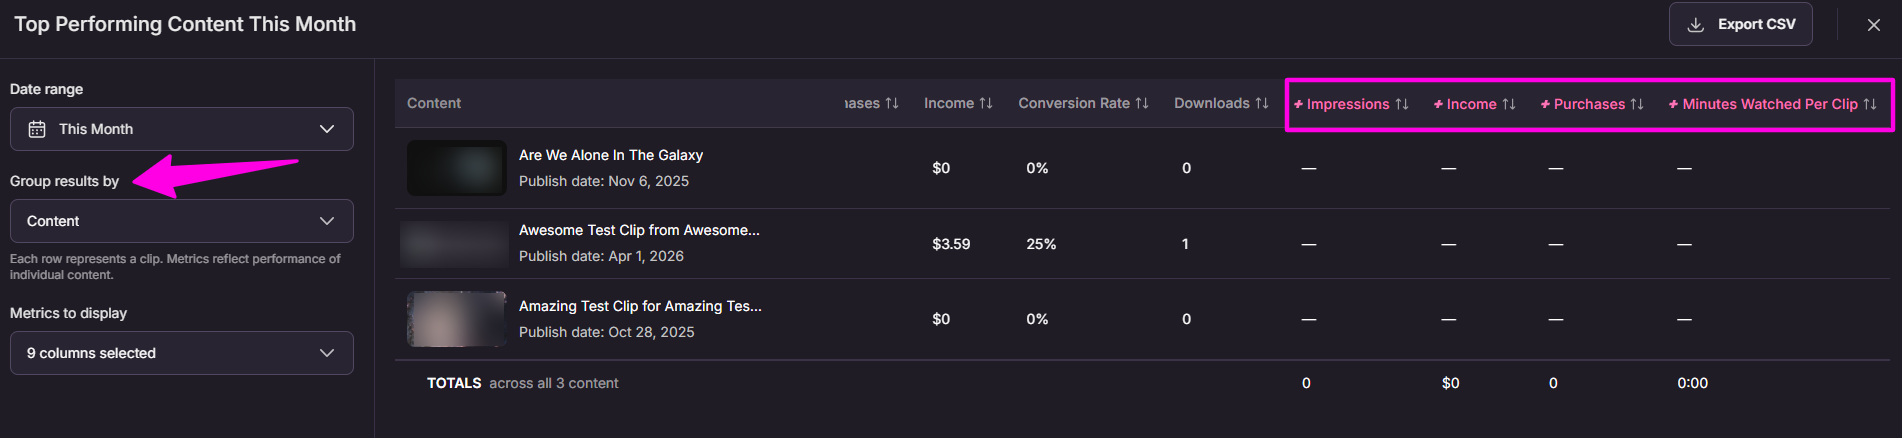
Each row represents a clip. Metrics reflect performance of individual content, including C4S+ data.
- Impressions - total impressions to pages of clips
- Purchases - number of purchases
- Income - creator’s net revenue from clips
- Conversion Rate - % of impressions that turn into purchases
- Downloads - total downloads of clips
- C4S+ Impressions - times this clip was shown to C4S+ subscribers
- C4S+ Income - revenue earned from C4S+
- C4S+ Purchases - number of purchases by C4S+ subscribers
- C4S+ Minutes Watched Per Clip - total minutes C4S+ subscribers watched this clip
Transactions
To view detailed transaction data, select “Transaction” and customize which transaction details and metrics you would like to display.
Each row represents a single sale. Used for accounting, CSV exports, and per-sale detail.
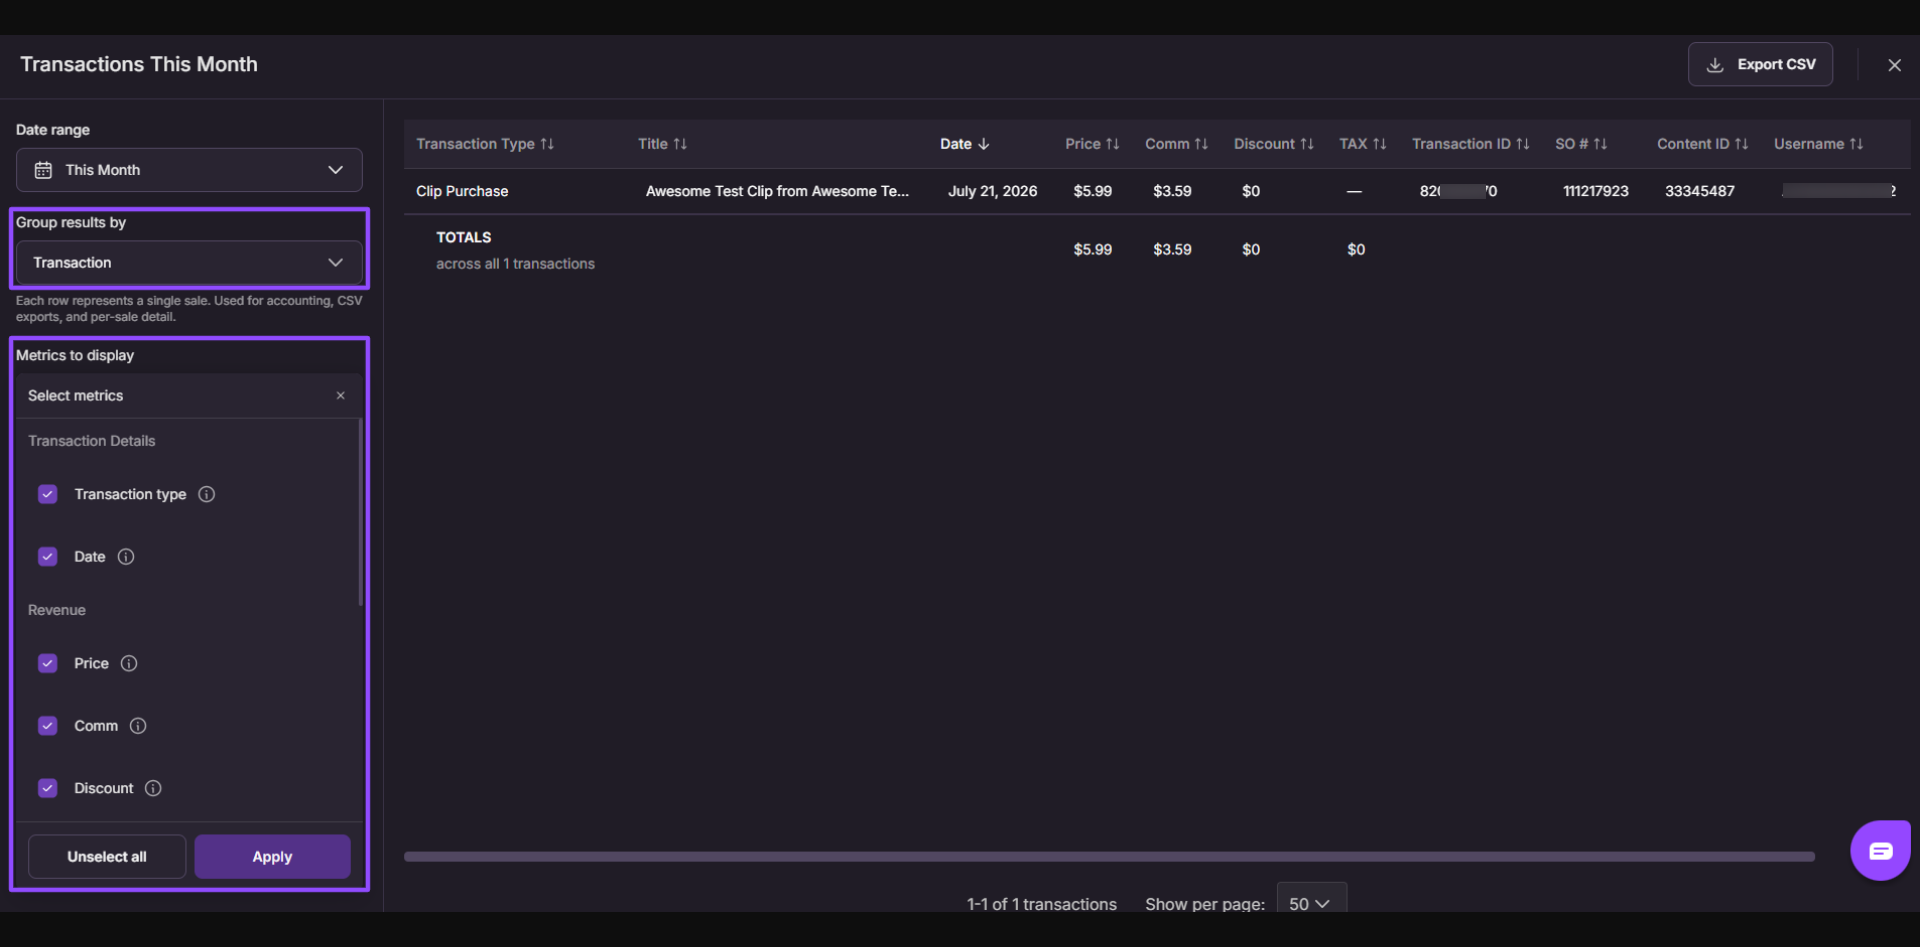
- Transaction Type - Type of transaction (Clip purchase / tip + if refund / chargeback)
- Date - Date of the sale
- Price - Sale price
- Comm - Creator commission
- Discount - Discount applied
- Tax - Tax collected
- Transaction ID - Unique identifier for the transaction
- SO# - Sales Order number
- Content ID - Identifier of the sold content
- Username - Buyer's username
- Country - Buyer's country
Here you can download your custom report by clicking Export CSV.

Statistics → Audience
URL: https://workspace.clips4sale.com/statistics/audience
Provides insights into your audience, including customer demographics, engagement patterns, and viewer behavior to help you better understand who is interacting with your content.
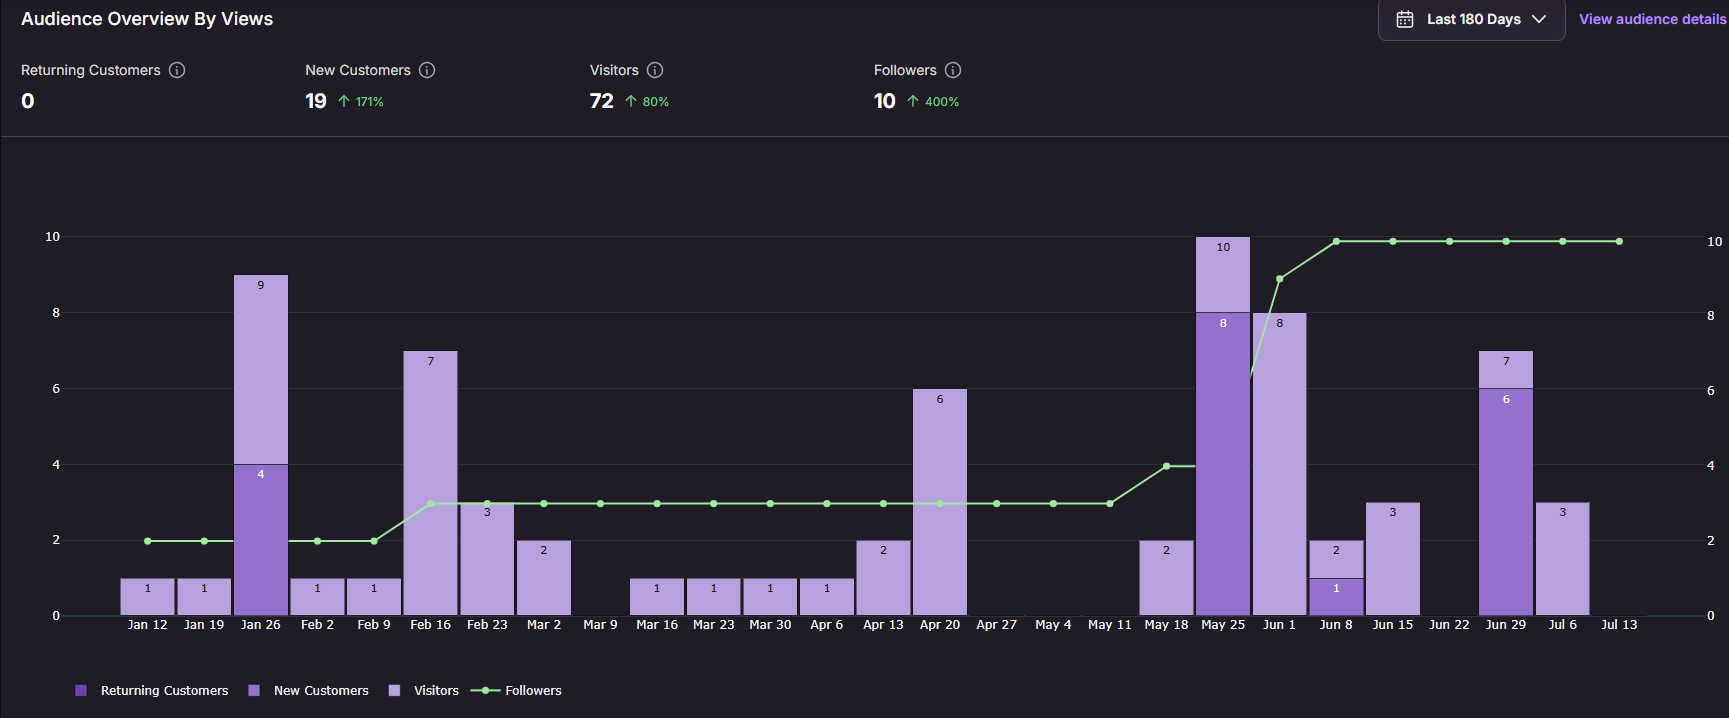
Audience Overview By Views
- Returning Customers - Customers who made more than 1 purchase for the selected period.
- New Customers - Customers who made 1 purchase for the selected period.
- Visitors - Customers who visited store pages but have not made any purchases.
- Followers - Amount of followers for the selected period.
- Store Engagement- These insights are based on your store’s activity and visitors, shown in Eastern Time (New York).
- Visitors Activity - Most Active Day, peak visit time, and impressions
- Purchase peak hours - Top purchase day, peak purchase hour, and purchases.
- Categories your followers like - Categories of clips purchased by your audience.
- Languages your followers speak - Most common languages among recent followers.
- Top Purchases - Your audience's buying trends by visitor type.
- C4S Audience Insights - These are platform-wide audience insights - top geographies and device types.